Class 9 | Chapter 14 | Statistics | Exercise 14.3 | Question 9

Question 9: 100 surnames were randomly picked up from a local telephone directory and a frequency distribution of the number of letters in the English alphabet in the surnames was found as follows:

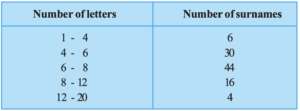
(i) Draw a histogram to depict the given information.
(ii) Writetheclassintervalinwhichthemaximumnumberofsurnameslie.

Statistics – Bar graph, Histogram & Frequency polygon

In this tutorial you will learn how to draw few very important and basic graphs in statistics. It is bit lengthy video that covers different scenarios like uniform classes, varying width classes, continuous classes etc. It is a must watch video for every beginner to intermediate level of student of statistics. This video covers the following graphs:

  • Bar graph
  • Histogram
    • Uniform width
    • Varying width
  • Frequency polygon 

Written by 

Mathematics is like music - Enjoy it!!!