Class 9 | Chapter 14 | Statistics | Exercise 14.3 | Question 8

Question 8: A random survey of the number of children of various age groups playing in a park was found as follows:

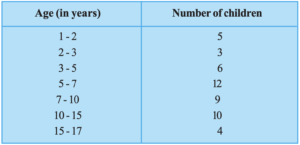
Draw a histogram to represent the data above.

Statistics – Bar graph, Histogram & Frequency polygon

In this tutorial you will learn how to draw few very important and basic graphs in statistics. It is bit lengthy video that covers different scenarios like uniform classes, varying width classes, continuous classes etc. It is a must watch video for every beginner to intermediate level of student of statistics. This video covers the following graphs:

  • Bar graph
  • Histogram
    • Uniform width
    • Varying width
  • Frequency polygon 

Written by 

Mathematics is like music - Enjoy it!!!