Class 9 | Chapter 14 | Statistics | Example 5 & 6

Example 5: In a particular section of Class IX, 40 students were asked about the months of their birth and the following graph was prepared for the data so obtained:

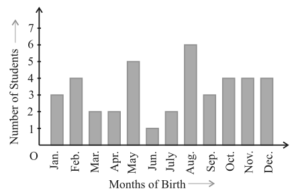
Observe the bar graph given above and answer the following questions:

  1. (i)  How many students were born in the month of November?
  2. (ii)  In which month were the maximum number of students born?

Example 6: A family with a monthly income of Rs 20,000 had planned the following expenditures per month under various heads:

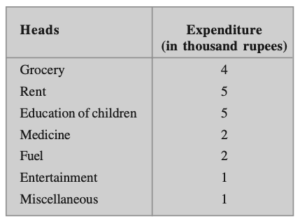
Draw a bar graph for the data above.

Statistics – Bar graph, Histogram & Frequency polygon

In this tutorial you will learn how to draw few very important and basic graphs in statistics. It is bit lengthy video that covers different scenarios like uniform classes, varying width classes, continuous classes etc. It is a must watch video for every beginner to intermediate level of student of statistics. This video covers the following graphs:

  • Bar graph
  • Histogram
    • Uniform width
    • Varying width
  • Frequency polygon 

Written by 

Mathematics is like music - Enjoy it!!!