Class 9 | Chapter 14 | Statistics | Exercise 14.3 | Question 7

Question 7: The runs scored by two teams A and B on the first 60 balls in a cricket match are given below:

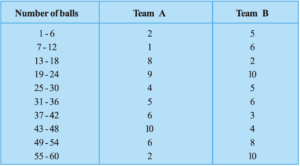
Represent the data of both the teams on the same graph by frequency polygons. [Hint : First make the class intervals continuous.]

Statistics – Bar graph, Histogram & Frequency polygon

In this tutorial you will learn how to draw few very important and basic graphs in statistics. It is bit lengthy video that covers different scenarios like uniform classes, varying width classes, continuous classes etc. It is a must watch video for every beginner to intermediate level of student of statistics. This video covers the following graphs:

  • Bar graph
  • Histogram
    • Uniform width
    • Varying width
  • Frequency polygon 

Written by 

Mathematics is like music - Enjoy it!!!