Class 9 | Chapter 14 | Statistics | Exercise 14.3 | Question 2

Question 2: The following data on the number of girls (to the nearest ten) per thousand boys in different sections of Indian society is given below.

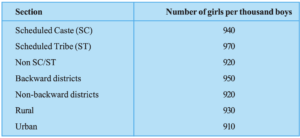
(i) Represent the information above by a bar graph.

(ii) In the classroom discuss what conclusions can be arrived at from the graph.

Statistics – Bar graph, Histogram & Frequency polygon

In this tutorial you will learn how to draw few very important and basic graphs in statistics. It is bit lengthy video that covers different scenarios like uniform classes, varying width classes, continuous classes etc. It is a must watch video for every beginner to intermediate level of student of statistics. This video covers the following graphs:

  • Bar graph
  • Histogram
    • Uniform width
    • Varying width
  • Frequency polygon 

Written by 

Mathematics is like music - Enjoy it!!!