Class 9 | Chapter 14 | Statistics | Exercise 14.3 | Question 1

Question 1: A survey conducted by an organisation for the cause of illness and death among the women between the ages 15 – 44 (in years) worldwide, found the following figures (in %):

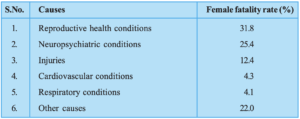
(i) Represent the information given above graphically.

(ii) Which condition is the major cause of women’s ill health and death worldwide?

(iii) Try to find out, with the help of your teacher, any two factors which play a major role in the cause in (ii) above being the major cause.

Statistics – Bar graph, Histogram & Frequency polygon

In this tutorial you will learn how to draw few very important and basic graphs in statistics. It is bit lengthy video that covers different scenarios like uniform classes, varying width classes, continuous classes etc. It is a must watch video for every beginner to intermediate level of student of statistics. This video covers the following graphs:

  • Bar graph
  • Histogram
    • Uniform width
    • Varying width
  • Frequency polygon 

Written by 

Mathematics is like music - Enjoy it!!!