Class 9 | Chapter 14 | Statistics | Exercise 14.3 | Question 3

Question 3: Given below are the seats won by different political parties in the polling outcome of a state assembly elections:

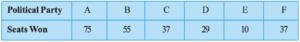
(i) Draw a bar graph to represent the polling results.

(ii) Which political party won the maximum number of seats?

Statistics – Bar graph, Histogram & Frequency polygon

In this tutorial you will learn how to draw few very important and basic graphs in statistics. It is bit lengthy video that covers different scenarios like uniform classes, varying width classes, continuous classes etc. It is a must watch video for every beginner to intermediate level of student of statistics. This video covers the following graphs:

  • Bar graph
  • Histogram
    • Uniform width
    • Varying width
  • Frequency polygon 

Written by 

Mathematics is like music - Enjoy it!!!